The spectroscopic Hertzsprung-Russell diagram of Galactic massive stars
Based on spectroscopically derived effective temperatures and gravities of almost 600 stars, we derive for the first time the observational distribution of Galactic massive stars in the sHRD (image). While biases and statistical limitations in the data prevent detailed quantitative conclusions at this time, we see several clear qualitative trends. By comparing the observational sHRD with different state-of-the-art stellar evolutionary predictions, we conclude that convective core overshooting may be mass-dependent and, at high mass (>15Msun), stronger than previously thought. Furthermore, we find evidence for an empirical upper limit in the sHRD for stars with effective temperature between 10000 and 32000K and, a strikingly large number of objects below this line. This over-density may be due to inflation expanding envelopes in massive main-sequence stars near the Eddington limit.
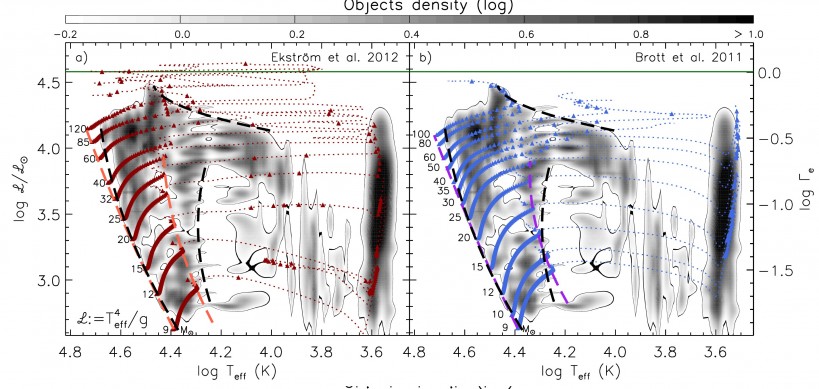
Grey scale representation of the probability density distribution of the location of 575 Galactic stars in the spectroscopic Hertzsprung-Russell diagram. Three empirical borderlines between densely populated regions and empty regions are drawn as black dashed lines. The electron scattering Eddington factor is given on the right ordinate axis, its limit for hydrogen-rich composition is represented by a green horizontal line. Overlayed are stellar evolution tracks for non-rotating stars with solar composition: a) Ekström et al. 2012 and, b) Brott et al. 2011. The zero age main-sequence and terminal age main-sequence positions of the models are connected through orange and purple dashed lines. Red and blue triangles are placed on the tracks separated by 0.1Myr.
link to article: http://www.aanda.org/articles/aa/full_html/2014/10/aa25028-14/aa25028-14.html
- 29.10.2014