The final task in the cg suite is cgspec . It displays both images and spectra, but its primary aim is spectral. You are referred to § 16.2.2 for extensive discussion of the many common keywords in the cg suite of software.
cgspec allows you to display an image, and then overlay small plots of spectra at different locations on the image. You can input up to five different 3-D images (cubes) from which the spectra are extracted ( e.g. each one representing a different spectral-line), as well as up to three contour images and one pixel map representation image. On colour devices, the spectra from different cubes are plotted in different colours. The spectral cubes can be of any size and be in any order. Neither do the pixel increments have to be the same between different cubes. However, the 2-D contour and pixel map images do have to have the same axis descriptors. The locations at which the spectra are drawn can be either on a regular grid or irregularly spaced at locations specified in a text file. In addition, you can bin the spectra up over some spatial region centered on the given locations.
cgspec uses the value spectrum for the keyword type to indicate that spectra are to be extracted from that image listed in the keyword in. For Zeeman enthusiasts, you can also plot the derivative of a spectrum image (with keyword type=dspectrum). See the help file for details.
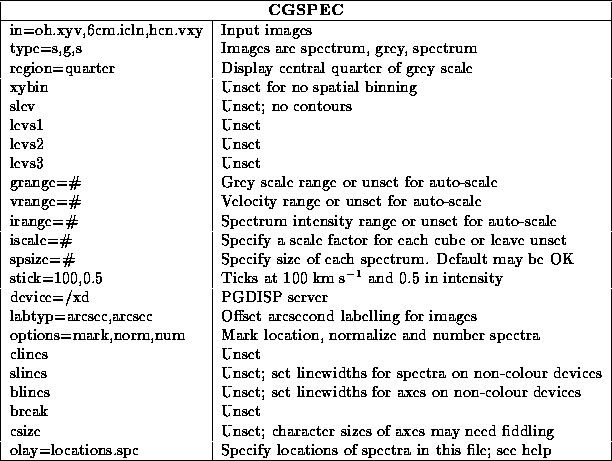
The following example shows how to overlay spectra at irregular locations from two cubes (which happened to have different axis orders) on a grey scale. Because spectra from different lines rarely have a similar range of intensities, you can use the keyword iscale to scale the spectra from each cube by some number to bring them into the same range. Alternatively, you can normalize all spectra to a peak of 1.0 ( options=normalize). You may need to specify the size of the spectra as a fraction of the plot window taken up by the spatial image ( i.e. the grey scale and contour plots), as the defaults of 0.1 may not be suitable.
The only keyword amongst all the scaling keywords that there is no default for is stick. This specifies the major tick mark increments on the velocity and intensity axes for the spectra; it is pretty much impossible to guess at a default.
There are a variety of choices about to how you draw the spectra. You can draw labelled borders around them or not ( options=frame), you can mark their spatial location with a cross or not ( options=mark; it can be hard to know sometime exactly which pixel the spectrum refers to), you can draw and label the x=0 and y=0 axes or not ( options=noaxes), you can choose any of these axis options but not put any numeric labels on them ( options=naked) as things can get pretty cluttered, and you can write a spectrum `number' in the corner of each spectrum ( options=number) which reflects the numeric location of the spectrum in the text file or the automatically generated grid. There are a few more options too, so see the help file for more details.
