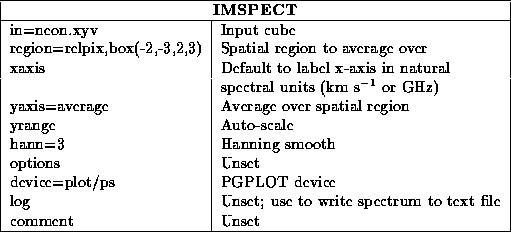
Note that imspect can also be used to plot the derivative of a spectrum ( options=1der or options=2der) which may be useful for Zeeman enthusiasts.
Now for imspec , which offers wider flexibility than imspect . It also plots spectra from a cube, but the cube can be in any order. It offers options to average or sum the data in RA-DEC, RA-VEL and DEC-VEL planes (keyword axes -- see the help file for details) so that you get profiles along the velocity, DEC, and RA planes respectively. You can also convert the units from Jy to brightness temperature and write the spectrum to a text file. imspec offers Hanning and boxcar spectral smoothing as well as the derivative options available in imspect . You can also specify a cut-off level below which data do not contribute to the spectrum and convert from Jy/beam to Jy.
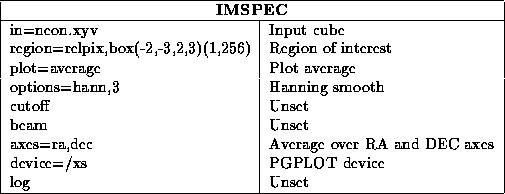
Note that the region you specify with imspec is limited to rectangular boxes only. The following example takes a cube in xyv order, computes the spectrum from channels 1 to 256 averaged over the central 4 by 6 arcsec, and then 3-point Hanning smooths it before displaying it on the local X-window.
