Subsections
These tests involve the same initial conditions as described in
Tables 2.1 and 2.2 but run on a 2D domain
with the initial discontinuity at an angle to the grid axes. The only
test which has different initial conditions is the Alfvén wave
test which is described separately below. If the angle is not zero or
45 then the fluxes in the
  and
and  directions are different
and it is a genuinely multi-dimensional problem. To avoid boundary
effects (and avoiding setting up complicated special boundaries) we
run the 2D simulations in a large domain and take results from a unit
area square subdomain with
directions are different
and it is a genuinely multi-dimensional problem. To avoid boundary
effects (and avoiding setting up complicated special boundaries) we
run the 2D simulations in a large domain and take results from a unit
area square subdomain with
 grid cells which is
unaffected by boundary waves. For the 2D tests the discontinuity
normal direction is set to an angle of
grid cells which is
unaffected by boundary waves. For the 2D tests the discontinuity
normal direction is set to an angle of
 or
or
 from the -axis. All points in the subdomain
are plotted in the figures below, with positions and vector quantities
rotated to the shock normal axes. For the angles used here most of
the points project on top of each other, but the projection means the
number of points appearing within a shock is obviously larger than the
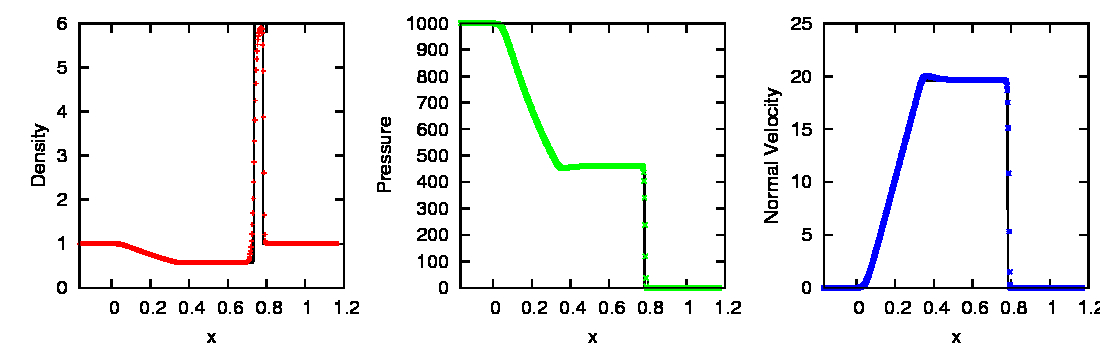
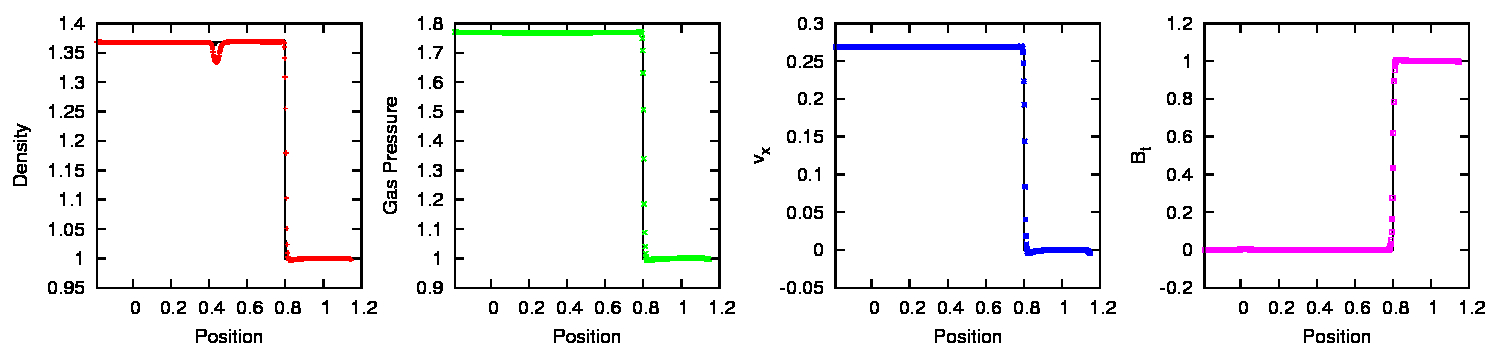
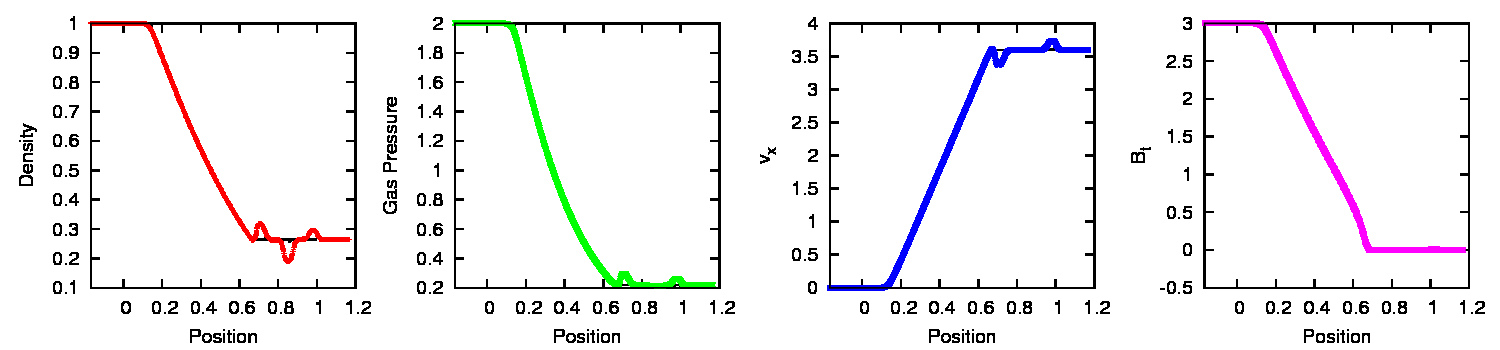
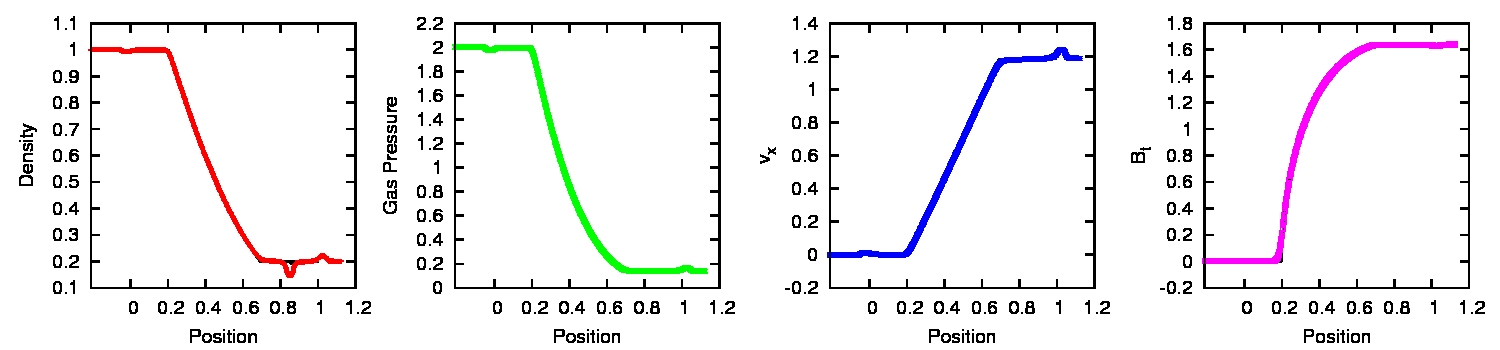
actual number required to resolve the shock (by a factor of 2). Hydro
shock tube results are shown in figure 2.3, and
MHD results in figure 2.4. The results are
comparable to the 1D simulations at equivalent resolution (see
figures 2.1 and 2.2) .
from the -axis. All points in the subdomain
are plotted in the figures below, with positions and vector quantities
rotated to the shock normal axes. For the angles used here most of
the points project on top of each other, but the projection means the
number of points appearing within a shock is obviously larger than the
actual number required to resolve the shock (by a factor of 2). Hydro
shock tube results are shown in figure 2.3, and
MHD results in figure 2.4. The results are
comparable to the 1D simulations at equivalent resolution (see
figures 2.1 and 2.2) .
This test is set up in the same way as in Stone (2008) using
the initial conditions from Tóth (2000). We have run the test with
a travelling wave on a periodic domain of size  with
with
 cells until
  when the wave has crossed the domain
five times. The transverse magnetic field (in the - plane) at
the final state for models with
when the wave has crossed the domain
five times. The transverse magnetic field (in the - plane) at
the final state for models with
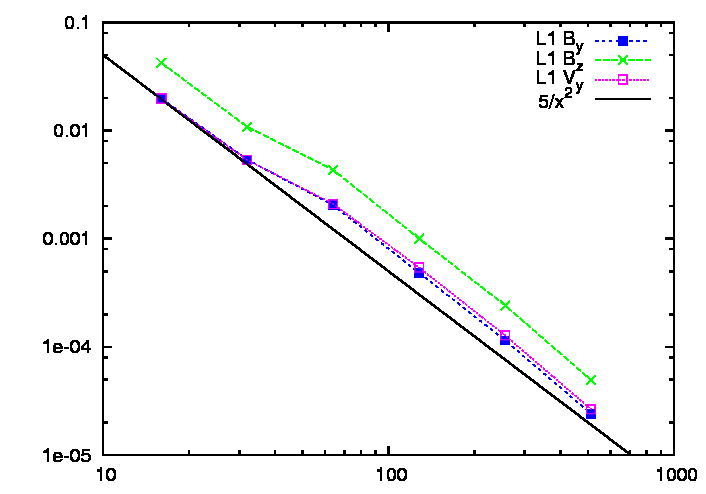
![$ N=[16,32,64,128]$](img89.png) is shown in the
left plot of figure 2.5. The initial wave amplitude is
0.1, so the 64 and 128 cell results have very little degradation.
Comparing with fig. 19 in Stone (2008) the low resolution
results presented here are clearly worse than for Athena. This is
partly because they use a third order reconstruction; piecewise
parabolic is a much better approximation to the extrema than piecewise
linear at low resolution for this test. The right plot shows the L1
error:
is shown in the
left plot of figure 2.5. The initial wave amplitude is
0.1, so the 64 and 128 cell results have very little degradation.
Comparing with fig. 19 in Stone (2008) the low resolution
results presented here are clearly worse than for Athena. This is
partly because they use a third order reconstruction; piecewise
parabolic is a much better approximation to the extrema than piecewise
linear at low resolution for this test. The right plot shows the L1
error:
 |
(2.1) |
for  cells, where
  is the reference state for each cell
and
is the reference state for each cell
and  is the approximate numerical solution. This clearly
converges quadratically with resolution, as it should for a second
order algorithm with no discontinuities.
is the approximate numerical solution. This clearly
converges quadratically with resolution, as it should for a second
order algorithm with no discontinuities.
Jonathan Mackey
2010-01-07