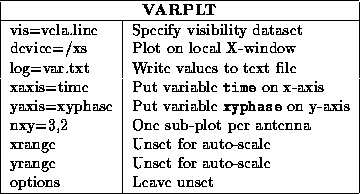
There are a variety of variables associated with the dataset that you may like to examine. For example, you may like to plot the system temperature as a function of time; it is usually stored as a variable (the visibilities are variables too). A list of standard visibility variables is given in Appendix C. Some of these variables are specific to the BIMA interferometer (Hat Creek), and so may be absent, or have no relevance to ATCA data.
The task varlist will tell you the names of the variables in your dataset. It will also tell you their data types (ascii, double precision, single precision and integer) and lengths.
After finding out the name of the variable of interest, you can plot it with varplt . The following example plots the on-line XY phase differences, stored in the variable xyphase (which will be present if you used atlod in MIRIAD ). You can also use varplt to write the variable's values to a text file with the standard log keyword.
