-
The AIPS
task to load RPFITS data is ATLOD
. Copious information
on this is
given in Neil Killeen's `Analysis of Australia Telescope Compact Array Data'.
However, before loading your data into AIPS
, if
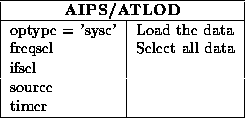
you have measured all four polarisation correlations, it is best to do a
preliminary run of ATLOD
using the optype ='sysc' option.
This run writes a
text file (
XYPHS_ xx, where xx is your AIPS
number)
containing the XY
phase for each antenna into the FITS area (
/DATA/FITS). Text files of system temperature are also written.
Although the various selection parameters of ATLOD
are still active,
you probably want to see all the data. Most of the other ATLOD
parameters are unimportant for this.
You should plot the phases (and the system temperatures) with the Unix program
pltsys
-- which prompts you for the name of the text file to plot as
well as other information. Examine these plots carefully to assess
their quality. You should use these plots to choose your reference
antenna (for calibration purposes). Choose the reference antenna to be the
antenna having the cleanest, most stable XY
phase measurements.
Determine some mean value of the XY
phase for each antenna from
the plots. The command pltsys
prints out both the average and
median XY
phase. As there are often outliers, the median is more likely
to reflect the true XY
phase value. Getting a good value is only
important for the reference antenna. Do not be too concerned if there
are large jumps in the XY
phases on antennas other than the reference
antenna.
 a.
a.
-
No XY
Phase Correction in ATLOD
:
You are now confronted with the decision of where to correct the XY
phase of the reference antenna. Your choice will depend on taste,
circumstances and the quality of the XY
phase measurements. There are
three main options:
- Correct using the MIRIAD
task atxy
(described later). This
is generally the best option.
This allows you to correct for the
variation of XY
phase with time. This will be essential if there is
significant time variability. To use this approach, you
will need to keep a copy of your XY
phase text file,
XYPHS_ xx.
- Correct in AIPS
ATLOD
. This has been the approach once
recommended, and is still useful if the XY
phase of at least
one antenna is quite constant with time. It also has the advantage of
getting the XY
correction step over and done with early. However the
user input can be error prone and tedious if the observation switches
frequency with time.
- When only XX
and YY
correlations have been measured, absolute
XY
phase
becomes irrelevant. Indeed it is not measured. In this case you do not
need to apply any XY
phase correction.
There are a number of other possibilities, which will not be described here.
If you are going to correct the XY
phases in MIRIAD
, or if you are not
going to correct XY
phase at all, then
you should now load your data without applying any XY
phase.
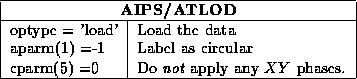
It is probably worth your while to pretend that the polarisations are
circular rather than linear with the usual fudges, as not all the
AIPS
software will recognize linears (most of the calibration software
will). You must not convert to Stokes parameters.
The appropriate ATLOD
parameters are
 b.
b.
-
Correcting XY
Phases with ATLOD
: If you want to correct the XY
phases with AIPS
ATLOD
,
the XY
phases on at least one antenna should be reasonably constant with
time (vary by no more than a few degrees). In this
case, give ATLOD
the values of the
XY
phases that you determined from the plots discussed above.
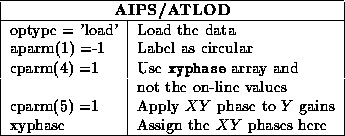
Input these values into ATLOD
with the xyphase array. You
must enter one value per antenna for each frequency. If you have more
than one frequency, you must enter XY
phases for all six
antennas, even if you do not have antenna 6 in the array during the
observation (the XY
phase value is not important for this
antenna, of course). Note that even if the values are close to zero,
you still should apply them. Applying a value of
zero is different from not applying anything.
Again, you must not convert
to Stokes parameters.
- Now flag the data in the way you would normally do with the
AIPS
tasks SPFLG
, TVFLG
, IBLED
, and UVFLG
.
Using SPFLG
is highly recommended, particularly at 20 and 13 cm, to
check for interference.
For continuum work,
to save disk space and to speed access to the data, you may consider
averaging your channels together to form ``channel-0''
datasets, using task AVSPC
. While this causes very little degradation
for
3 cm observations, forming ``channel-0'' results in bandwidth smearing
in 13 and 20 cm observations, and so is probably inadvisable for
high dynamic range work there. For high dynamic range work at 6 cm, it is
debatable whether averaging is detrimental. If in doubt, do not average. It
is always possible to form a channel-0 dataset later anyway.
One other consideration in determining whether or not to average is whether
or not you are going to apply XY
phase corrections with task atxy
.
For obscure reasons, if you used AIPS
ATLOD
,
atxy
needs to know the ``sideband indicator''
of the data. The sideband indicator, which is  , is copiously
reported by ATLOD
, both in its output to the terminal, and in the
history file. The sideband indicator also happens to be the sign of the
channel frequency increment. This is how atxy
normally determines
them.
However, if you form a channel-0 dataset, the sign
of the frequency increment is lost! So if you give atxy
a channel-0
dataset, you will also have to tell it the sideband indicators.
You must give it a sideband indicator for each IF. Provided the
sideband indicator remains constant with time, this is little more than
an annoyance. However if the sideband indicator varies with time, you
are in some trouble. Overall it is best not to form
channel-0 datasets if you used AIPS
ATLOD
and you are going to
use atxy
.
, is copiously
reported by ATLOD
, both in its output to the terminal, and in the
history file. The sideband indicator also happens to be the sign of the
channel frequency increment. This is how atxy
normally determines
them.
However, if you form a channel-0 dataset, the sign
of the frequency increment is lost! So if you give atxy
a channel-0
dataset, you will also have to tell it the sideband indicators.
You must give it a sideband indicator for each IF. Provided the
sideband indicator remains constant with time, this is little more than
an annoyance. However if the sideband indicator varies with time, you
are in some trouble. Overall it is best not to form
channel-0 datasets if you used AIPS
ATLOD
and you are going to
use atxy
.
After flagging (and possibly averaging), write
your data as a FITS file using FITTP
. It is probably most
convenient to
write out a multi-source file. At this stage you have no
calibration -- only flagging tables (which you can apply in MIRIAD
later).
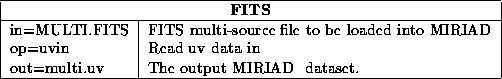
- Read the data into MIRIAD
using fits
. Task
fits
does not apply AIPS
flagging tables ( FG tables). Instead
you have to use another task to do this -- fgflag
.
Tasks fits
and fgflag
are discussed in
Chapters 8 and
9 respectively, although they are usually fairly straight forward. An
exception is for spectral line observations, where the velocity system
should be defined with fits
-- see Chapter 15.
At this stage it is worth running
uvindex
. This produces a summary of your dataset, which
you should probably save in a log file. Inspect this summary
carefully, particularly the frequencies (especially in fits
complained about inconsistent frequency definitions). If the frequency
information looks incorrect, read Chapter 8 more carefully
and/or seek help.
- Skip
this step if you have only measured two polarisation products.
Otherwise now is the time to apply your XY
phases to the data if you
have not already done so with AIPS
ATLOD
. As mentioned above,
the task to do this is
atxy
. If you used AIPS
ATLOD
, you should also have
XY
phase text file that it produced.
Let us discuss the various input parameters:
- vis: The name of the input dataset. Generally this will
be a multi-source dataset.
- xyphase: You need
to give the name of the XY
phase text file that AIPS
ATLOD
produced.
Generally this will be of the form XYPHS_ xx,
where xx is your AIPS
user number.
Task atxy
can also be used to correct the XY
phases of
data loaded with MIRIAD
atlod
where options=xycorr
was not used.
In this case, the on-line XY
phase measurements are contained
within the dataset (as the variable xyphase), and you do not require
a input text file.
- refant:
It is best to correct for a time varying XY
phase on only one
antenna. All other antennas are assumed to have an XY
phase of zero (in
the AIPS
XY
phase convention -- see below).
The antenna which is corrected for a time varying XY
phase
should be the antenna
with the cleanest, most constant XY
phase (as determined by the pltsys
or varplt
plots). This will be the antenna you will use as the reference antenna for
calibration purposes. It is not necessarily the same as the antenna
used as the reference during the observation -- although it will often
happen that it is the same. You give this antenna via the refant keyword.
Note that if you have broken a dataset up into sub-files before using
atxy
(e.g. break it up into a calibrator dataset and a program
source dataset), then you must correct the same antennas in
all datasets.
- interval: This gives one or two numbers, both in minutes,
which determine
the length of a solution interval (the time interval over which an XY
phase
is solved for; should be comparable to the time scale on which the
XY
phases are constant over -- use varplt
). The first number gives the maximum length of a solution
interval, whereas the second gives the maximum gap within a solution
interval. A new solution interval is started when either the maximum
time length is exceeded, or a gap larger than the maximum gap is encountered.
The default maximum length is 30 minutes. The default maximum gap is the
same as the maximum length.
- break: If significant steps in the XY
phase occurs during
the observation (usually caused by resetting the delays), then it is
best to prevent a solution interval spanning this time. To do this, you
list the times where there was a break in the XY
phase.
The times are given in the normal MIRIAD
time format (i.e. either
hh:mm:ss or
yymmmdd:hh:mm:ss, such as 93oct18:19:21:00, for 7:21 pm on 18 October,
1993).
- sideband: As noted above, atxy
needs to know the
sideband indicator for for data
loaded with AIPS
ATLOD
. For multi-channel data, this will
be the sign of the frequency increment. However this sign will be
lost if you form a channel-0 dataset. In this is what you have done,
you will need to tell atxy
the sideband indicators for each
IF band. Note that atxy
cannot cope with a channel-0
dataset if the sideband indicators change with time.
- out: The name of the output dataset. Apart from application
of the XY
phase, this will be a copy of the input dataset.
Typical inputs to atxy
are given below