For high dynamic range multi-frequency synthesis experiments, spectral index information is often solved for in the deconvolution step. This is performed by task mfclean (see Section 13.3). The spectral index information is saved by mfclean as the second plane of the CLEAN component image (the first plane is just the regular flux density CLEAN components). The second plane is not actually the spectral index -- it is the spectral index multiplied by the source flux density. Additionally it needs to be convolved with a gaussian or the like, to de-emphasize the tendency of CLEAN algorithms at rather poor extrapolation of high spatial frequencies. Task mfspin can be used to go this.
Generally, if you are interested in spectral indices, multi-frequency synthesis is not the approach you would take. Multi-frequency synthesis is useful only over small spreads in frequency, whereas spectral indices are more reliably estimated over larger frequency ranges -- the domain where mfspin is useful is somewhat limited.
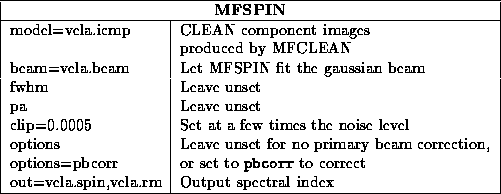
Given a CLEAN component image produced by mfclean , mfspin convolves the two planes with a gaussian CLEAN beam (specified explicitly via the fwhm and pa keywords, or implicitly via the beam keyword -- the dirty beam), clips them at some threshold, and then performs the appropriate division (flagging the output when the division is undefined). The clip level should be a few times the rms background level in the restored image. Ideally this will be a the theoretical noise level.
When determining the spectral index over a field which is large relative to the primary beam, the variation of the primary beam with frequency mimics a spectral index. This is because the the primary beam attenuation is a function of frequency, However it is not of consequence near the pointing centre and it is a predictable effect. To estimate the effect, consider a gaussian model of the the primary beam response, P :

Here  is the angular distance from the pointing centre, and
 is the primary beam FWHM at the reference frequency
  ,
and
,
and  . This will result in an apparent spectral index of

At the half-power point ( ), and at the reference
frequency, this corresponds to an apparent spectral index of -1.4.
Provided the fractional bandwidth is not too large, the apparent spectral index will be the sum of the true source spectral index and a part caused by the primary beam variation. Because the primary beam effect is predictable, the apparent spectral index can be corrected to give the true spectral index. Use the option pbcorr to perform this correction.
Typical inputs to mfspin are:

When imaging Stokes Q
and U
, Faraday rotation will cause a spectral
variation. For a rotation measure RM
, speed of light c
,
intrinsic polarisation angle  and total linearly polarised intensity
P
(a real number) with spectral index
  , then Q+iU
will
vary as

It is useful to express this variation as an
``apparent complex spectral index'',  , which is the ratio

This quantity can be readily computed from the results of the multi-frequency deconvolution of Q and U maps. For a rotation measure of 30 rad/m/m and frequency of 4.7 GHz, this results in an imaginary part of the complex spectral index of -0.49i .
Again, multi-frequency synthesis is not the ideal approach to
determine these. To start with, a
linear approximation is made -- certainly  ambiguities are
not dealt with in the rotation measure. However, the linear approximation
should be reasonable, provided

The Q and U images must also have high dynamic range ( > 200). As rotation measure and the intrinsic spectral index of the polarised intensity are measured in a coupled manner, errors in determining one of them will feed into the other. Consequently if one of the two terms is dominant, the other term is likely to be completely corrupted by errors. All the same, there are some instances where useful results can be derived.
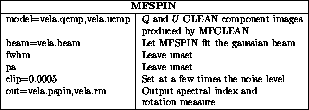
To determine rotation measure and spectral index of the polarised intensity, you will need CLEAN component images of Q and U produced by mfclean (via the model keyword). Both Q and U should be given. To get both the spectral index and the rotation measure, you must give two output dataset names to the out keyword. If you give only one name, you will only get the polarised intensity spectral index. Typical inputs are:
