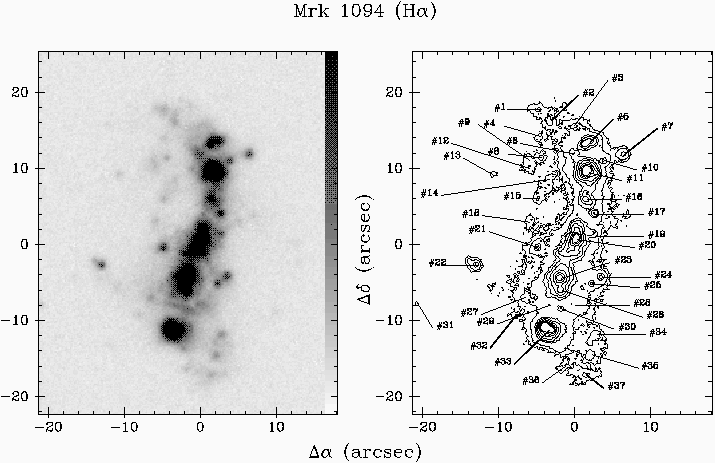
Fig. 1.
Grey-scale image (left) and contour plot (right) for the continuum subtracted
Halpha image of Mrk 1094.
Labels in the contour plot refer to the different star-forming knots detected.
North is at the top and East on the right
Fig. 2.
Halpha equivalent width map of Mrk 1094.
The continuum-subtracted Halpha image is superposed as
isocontour plot.
Color scale is logarithmic (white: minimum, 25 Å;
black: maximum, 480 Å).
North is at the top and East on the right
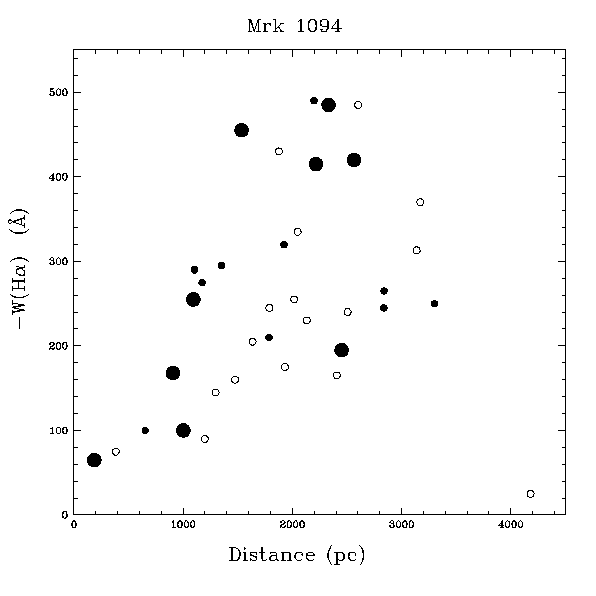
Fig. 3.
Distance to the center-W (Halpha) plot for the
37 knots detected in the continuum-subtracted Halpha image
of Mrk 1094.
The different shapes of the points refer to differences in
Halpha luminosities.
Large filled circles: L (Halpha)
> 1039, small filled circles: 5·1038 < L (Halpha) < 1039,
open circles: L (Halpha) < 5·1038
Fig. 4.
Distribution of the age of the different knots with respect to the distance
to the center.
The bar reflects the interval in age according to the error associated to the
Halpha equivalent width for each knot
Links (back/forward) to:
| First version: | 13th | March, | 1998
|
| Last update: | 28th | September, | 1998
|
Jochen M. Braun &
Tom Richtler
(E-Mail: jbraun|richtler@astro.uni-bonn.de)


