Fig. 1.
GS59.9-1.0+38: lb diagram at a velocity corresponding to the
circular velocity of the bubble center (left panel); lv diagram
taken through the centre of the structure (right panel)

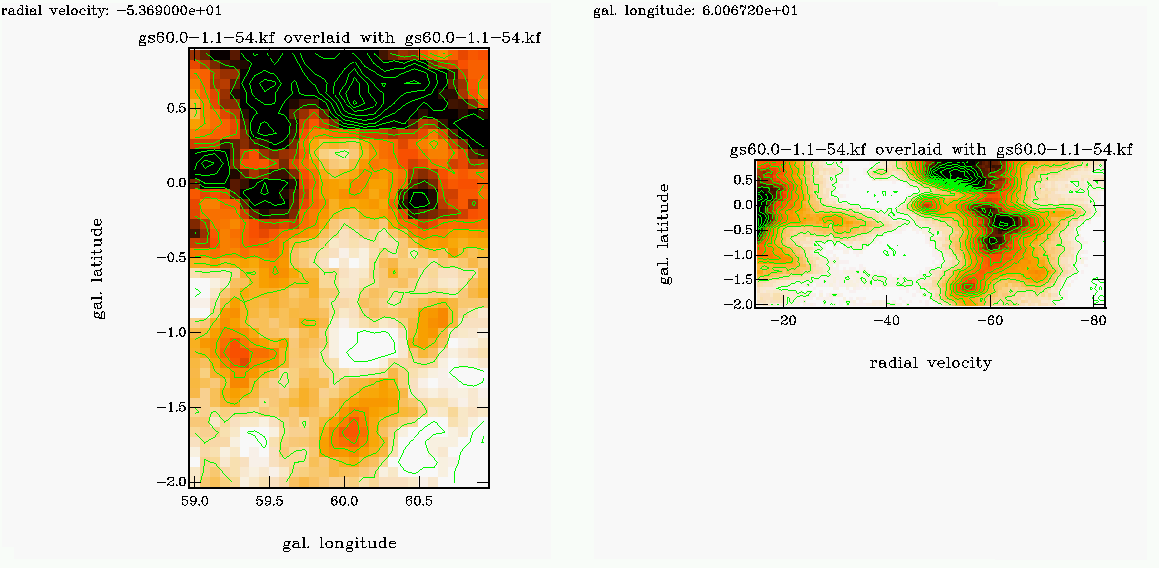
Fig. 2.
GS60.0-1.1-54: lb diagram of the structure (left); bv diagram
through the center (right)
Diagrams like Fig. 1 and 2 can also be seen in the review contribution
'Holes and Shells in Galaxies'
by Jan Palous:
GS62.1+0.2-18 (Fig. 1) and
GS60.1-0.3+15 (Fig. 2).
Links (back/forward) to:
| First version: | 06th | July, | 1998
|
| Last update: | 29th | September, | 1998
|
Jochen M. Braun &
Tom Richtler
(E-Mail: jbraun|richtler@astro.uni-bonn.de)

