

Notes:
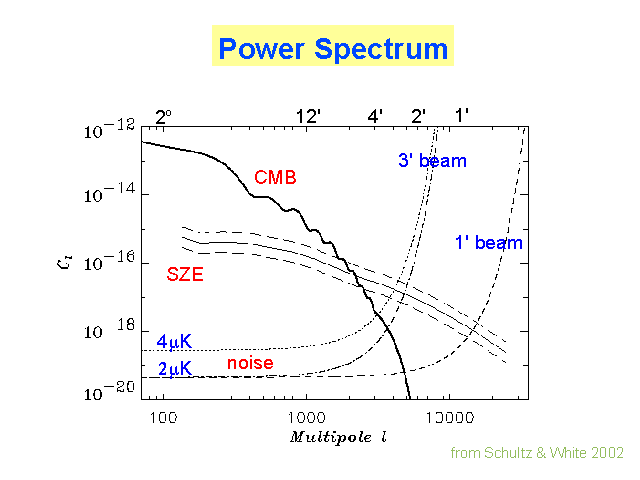
This graph shows the role of sensitivity and resolution in SZE surveys. The three types of curves are the power spectrum of the primary CMB anisotropies, the SZE signal (an average of 10 simulations) and the instrument noise. In multi-frequency observations the primary CMB signal could be strongly suppressed. A single color survey is sensitive over the scale for which the SZE is not overpowered by either CMB anisotropies or instrument noise.
The normalization of the SZE PS depends on the cosmology, particularly on the value of sigma_8. Noise levels are in micro K per 1' beam.
Recent 30 GHz measurements with BIMA and the CBI measure CMB anisotropy on scales of 2' to 90deg. At low multipoles (l<2000) anisotropy is generated at z>1000.
(Schulz & White 2002, astro-ph/0210667)
The simulations assume w= -1, ie. a cosmological constant rather than quintessence.
Prior knowledge of the Hubble constant is assumed: h=0.72 +- 0.08


