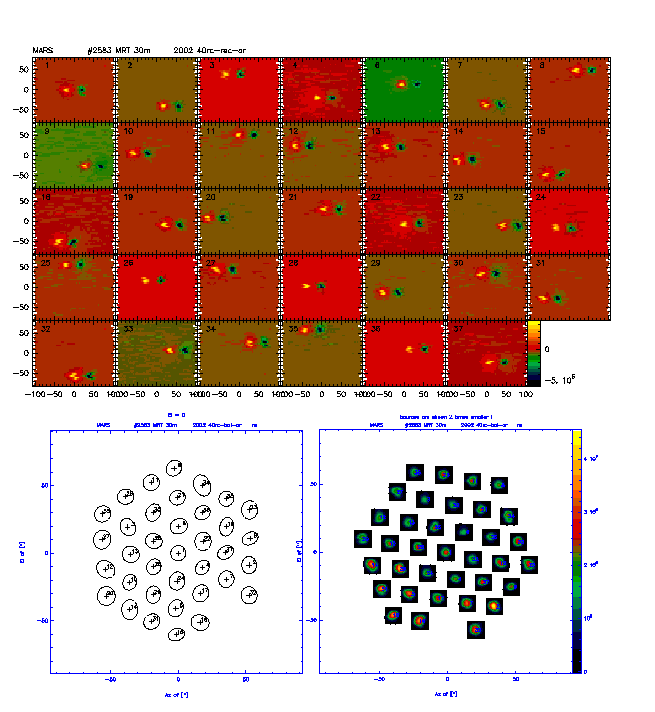
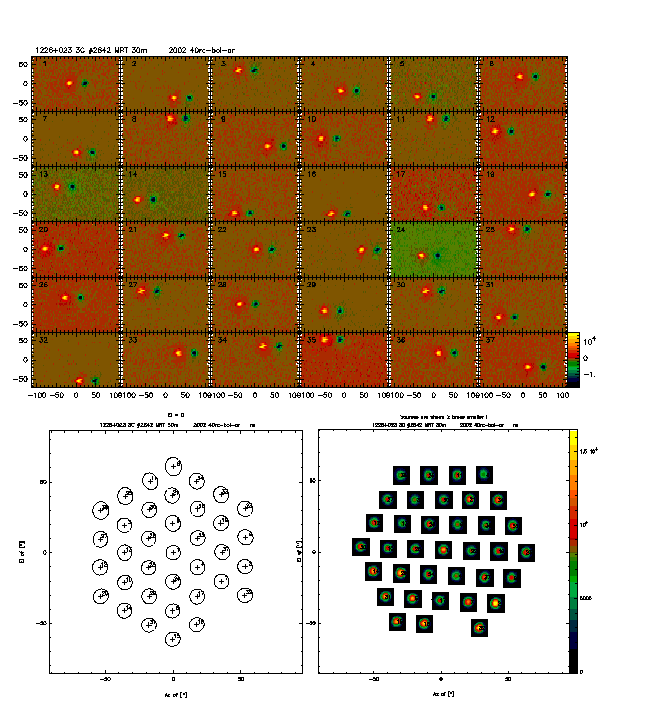
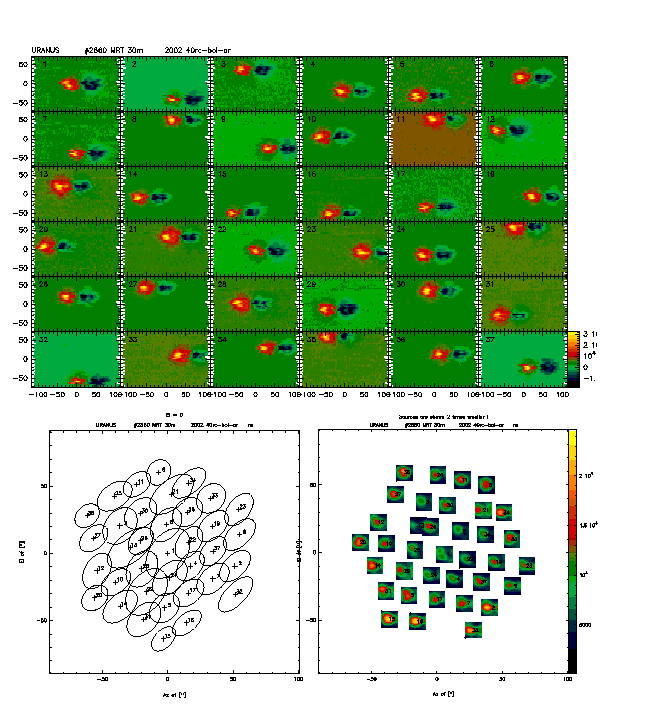
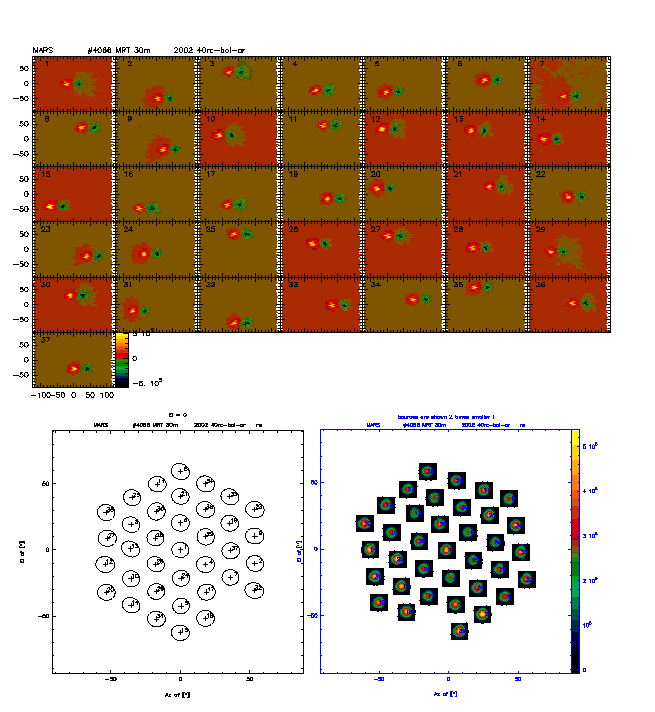
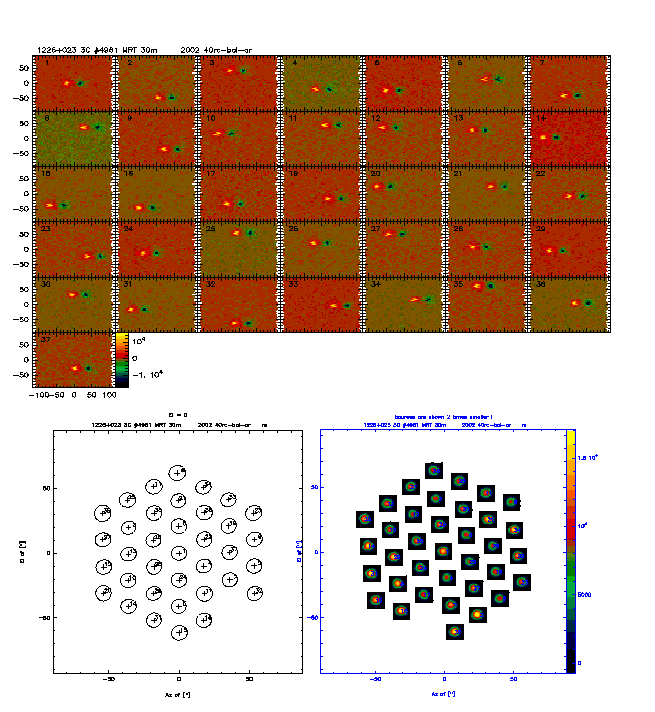
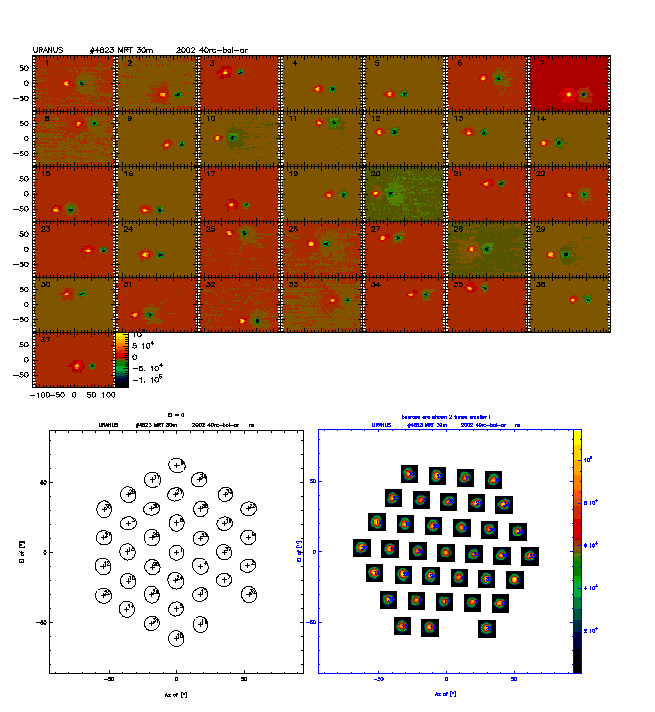
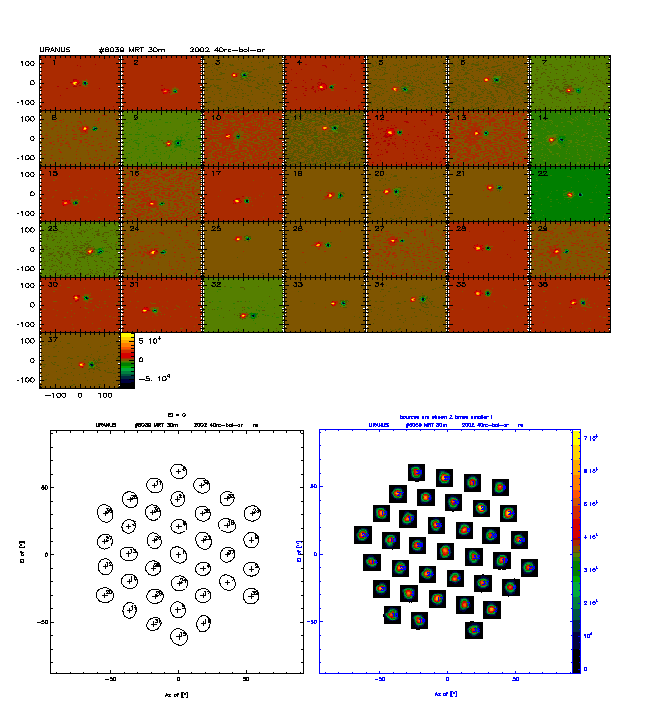
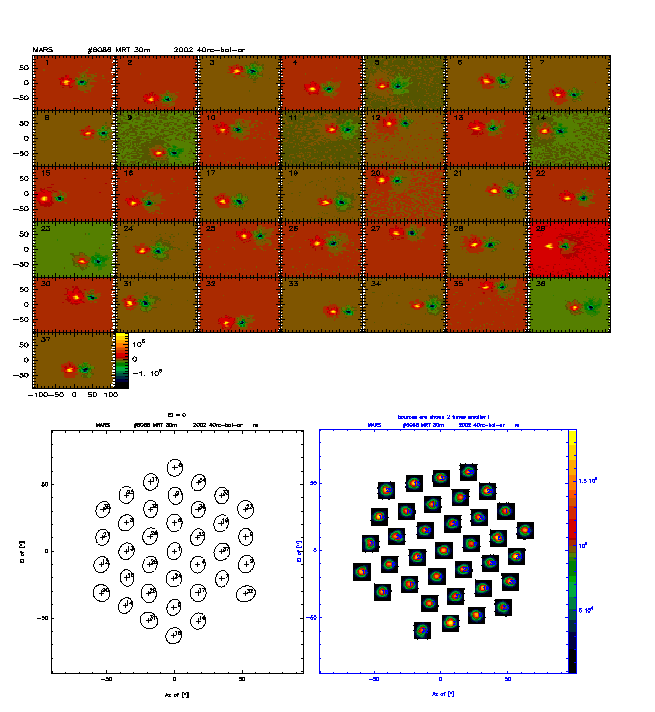
Array parameters derived from above listed maps. Top (or left) image
show the array in January and February, excluding 22583 and 22860.
The bottom (right) image shows the three measurements in May.
The size of the circles is proportional to the gain correction factor.
The black lines show the average.
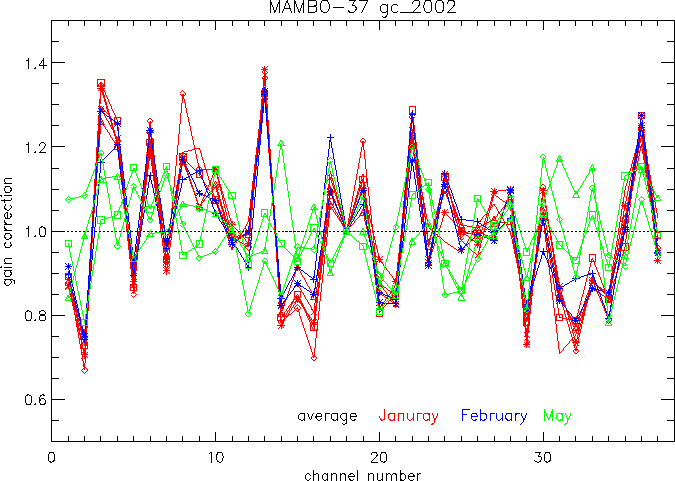
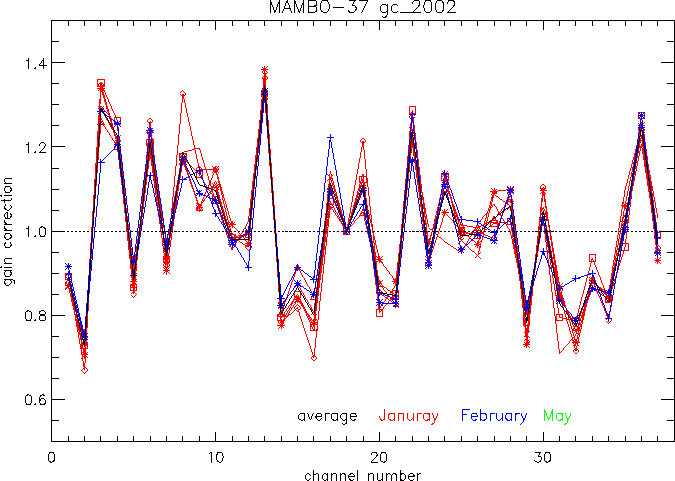
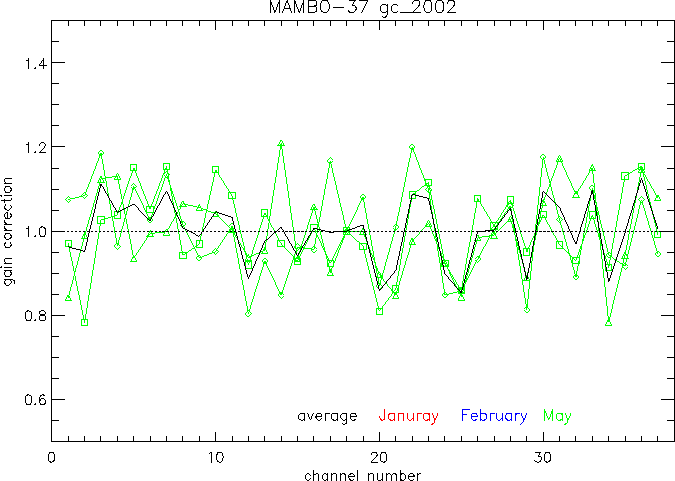
Gain corrections for all the good Jan-May 2002 calibration maps. Note that the May measurements are quite different from those in January and February. This is why we created separate rcp files for the two periods. The cause of this is that the array was re-aligned before the May period. Below you see the two periods separately, with the average gain correction factors plotted as a black line.
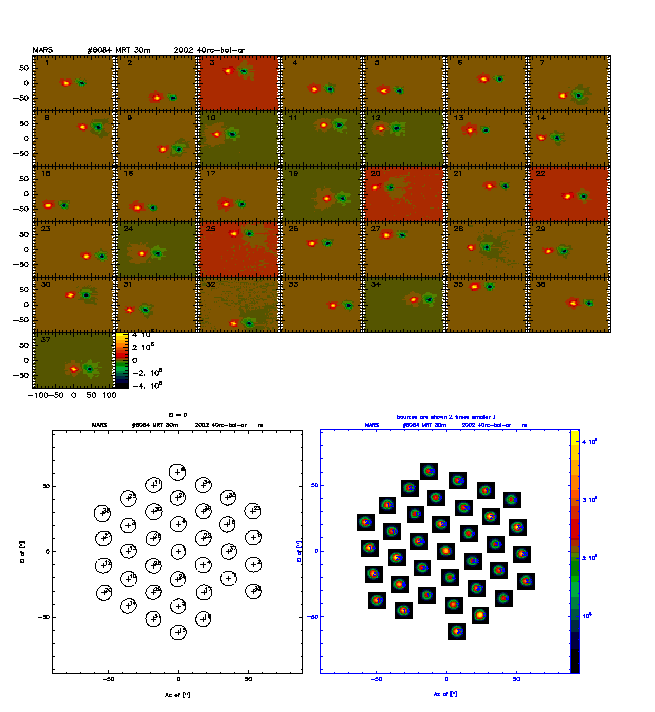
Left (top): Averaging rcps from 8 maps: 14687 15182 17532 17965 34104 36390 36526 44651. Right (bottom): RCPs of the three rejected maps 14576 (red),17859 (green), 20569 (blue), compared with the average of the 8 good scans.
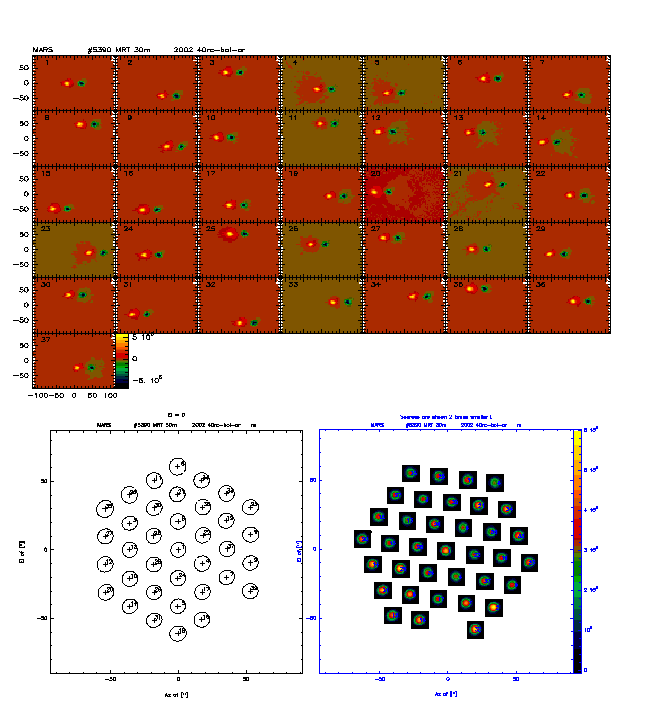
Gain corrections of the 8 good MAMBO-117 maps. Red are the 14687 15182
17532 17965, green are 34104 36390 36526 44651, black is the averge.
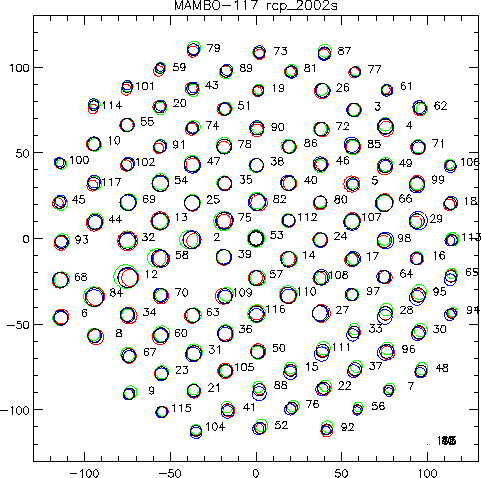
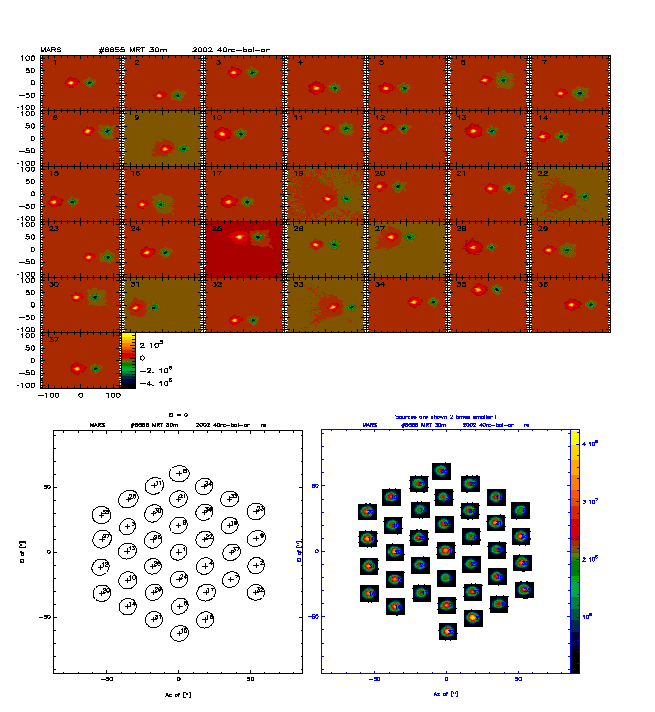
117-MAMBO array parameters, averaging 20021023_3826 (Neptune, red),
20021023_3834 (Uranus, green) and 20021024_3941 (Mars, blue), with the
average shown as black circles. Bad channels: 1, 11, 42, 83, 103.